“Virtual Reality to Visual Analytics” Adventures of A Government Researcher
Talk Abstract
Visualization, interactive computer graphics, and related topics have been a particularly dynamic area of computational learning, modeling, and decision making, producing advances that impact society. Working at times in a research laboratory and at times for two science funding agencies, Dr. Rosenblum held positions at the level of an individual researcher, Director of a VR Laboratory, and funding agency Program Director. This talk will discuss some of his experiences, including insight into how science programs in funding agencies are initiated.
Date and Time
Location
Hosts
Registration
-
 Add Event to Calendar
Loading virtual attendance info...
- Contact Event Hosts
-
Organized by IEEE NY Section and Fordham University
Speakers
Lawrence Rosenblum, Ph.D., IEEE Fellow
“Virtual Reality to Visual Analytics” Adventures of A Government Researcher
Background:
Larry’s article "Adventures of a Government Researcher" illustrates how significant new U.S. government research programs were initiated for mobile augmented reality and for data and visual analytics. It also discusses events that transpired during his government career. The article can be accessed at: Adventures of a Government Researcher | IEEE Journals & Magazine | IEEE Xplore
Biography:
After graduating from The Ohio State University with a Ph.D. in Mathematics, Larry’s early professional career at the Naval Research Laboratory (NRL) involved designing real-time data collection systems for the ocean sciences and analyzing collected data. Prone to seasickness and excited by a computer graphics class, he switched career paths. He began applying computer graphics and computer vision techniques to ocean science and engineering problems and demonstrated the value of these methods.
In 1992, Larry began a two-year assignment at the Office of Naval Research (ONR) European Office with responsibility for interacting with leading European scientists. His electronically distributed “Realization Reports” were widely disseminated and reproduced in IEEE/ACM magazines and newsletters. He organized the National Academy of Sciences International Lecture Series into Eastern Europe. He initiated and ran the ONR Visualization Workshop, where international experts defined a SciVis research agenda. The resulting Academic Press/IEEE Press book containing research papers and the agenda led to ONR funding.
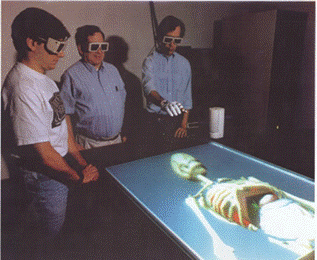
Returning to NRL, Larry initiated a Virtual Reality (VR) Laboratory. VR Projects included remote engineering design, VR evaluation studies, and developing interoperable VR software. A VR Responsive Workbench based system was successfully demonstrated in a Marine Corps command center at the Hunter Warrior AWE. Working with Steve Feiner (Columbia University) who had developed seminal demonstrations of mobile augmented reality (MAR), the VR Lab developed prototype MAR systems that provided vital information to mobile warfighters. The successful demonstrations of the Battlefield AR system (BARS) resulted in ONR’s Andre van Tilborg having Larry develop a sizable ONR-funded MAR program that supplemented the BARS research.
In 2004, Larry moved to the National Science Foundation (NSF) as Program Director for Graphics and Visualization in the Computer and Information Science and Engineering Directorate. There, he initiated a five-year NSF program: Foundations of Data and Visual Analytics (FODAVA) that introduced mathematical and computational science methods into the visual analytics process to reduce the dimensionality of large, complex data sets. FODAVA-Lead institution Georgia Tech developed a course based on FODAVA. First taught in spring 2013 to 35 students, by 2021 it was a core class in a new MS degree program in Analytics taught to 2157 students across a three-school consortium. DAVA is now recognized as a critical pillar supporting discovery and innovation throughout academia and public and private organizations.


